You are now ready to Create/run your report.
In Salesforce, go to Reports.
Click New Report
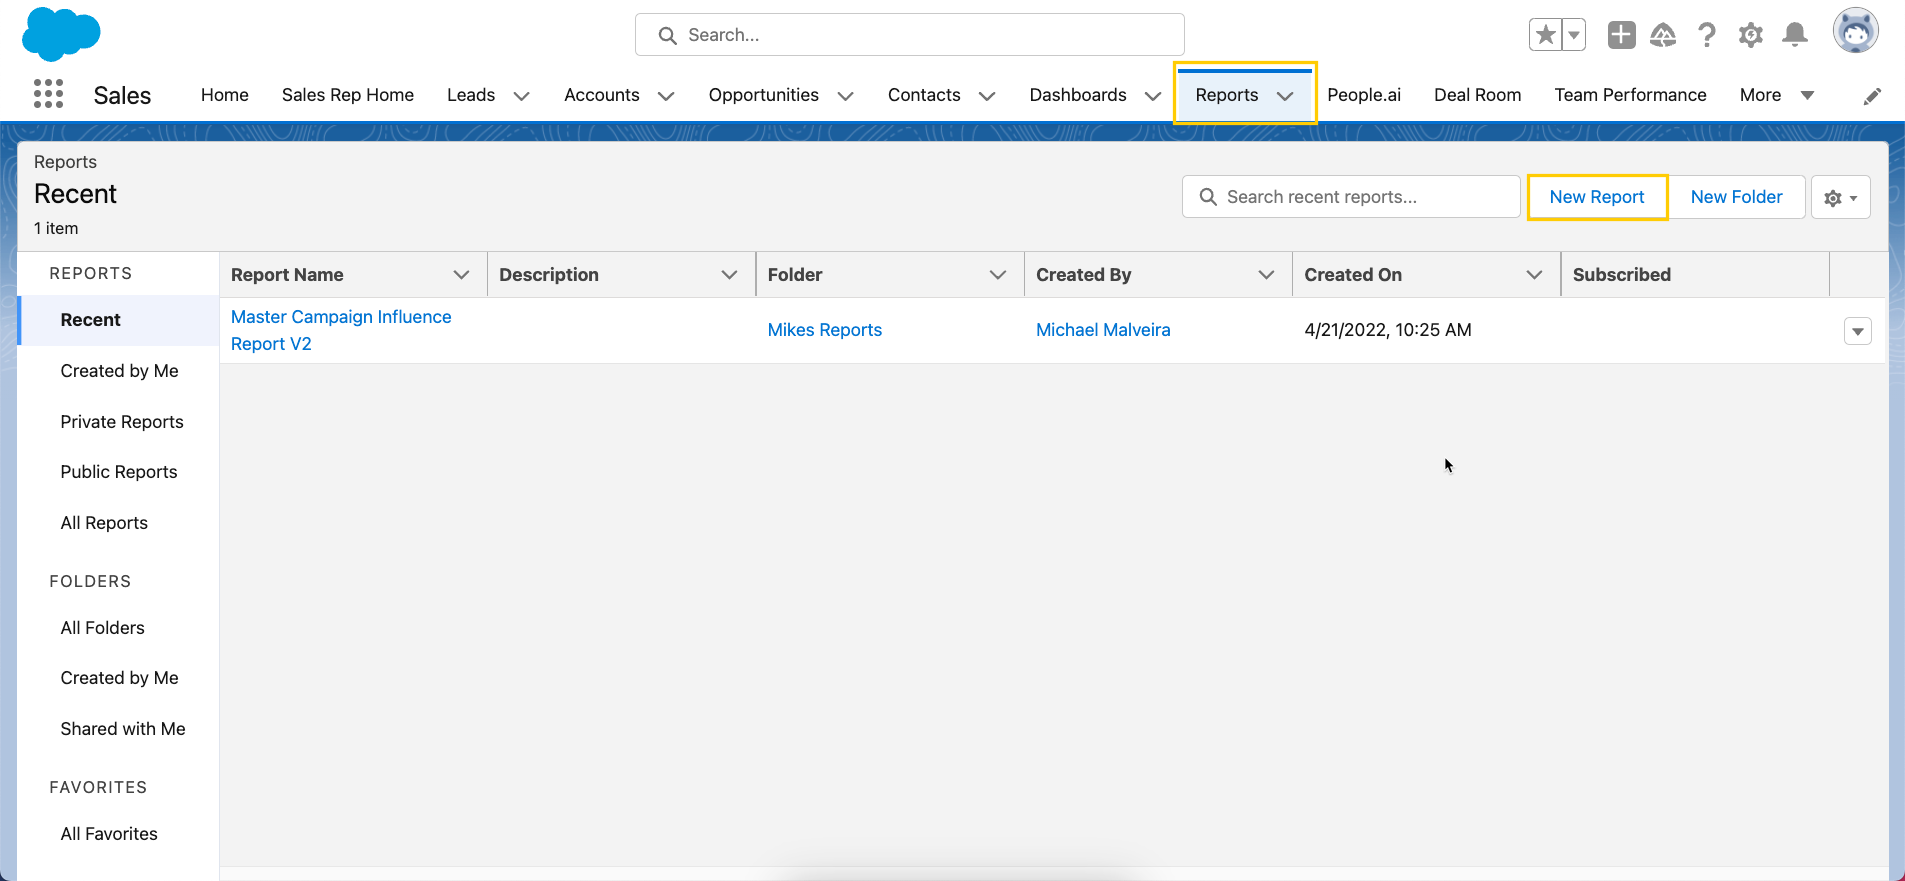
Search for and locate your newly created custom report type
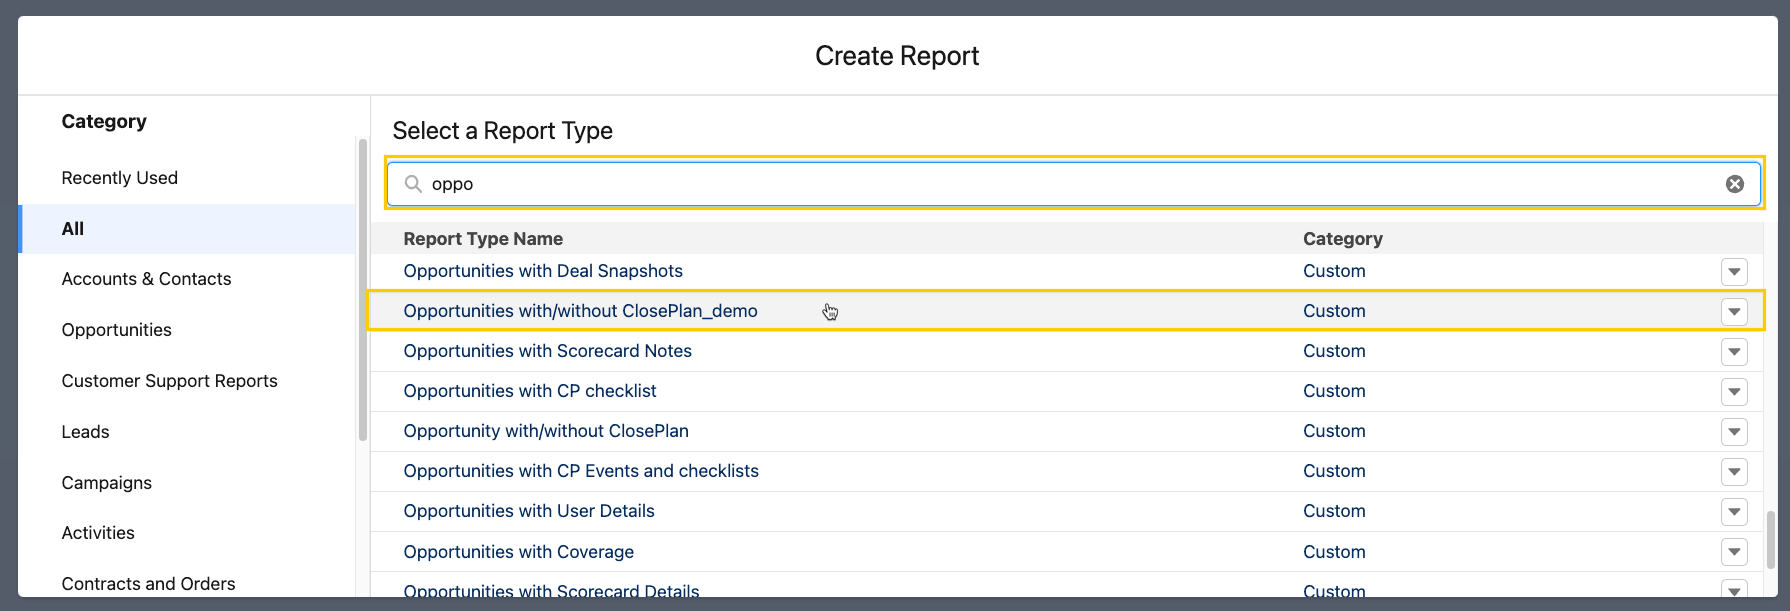
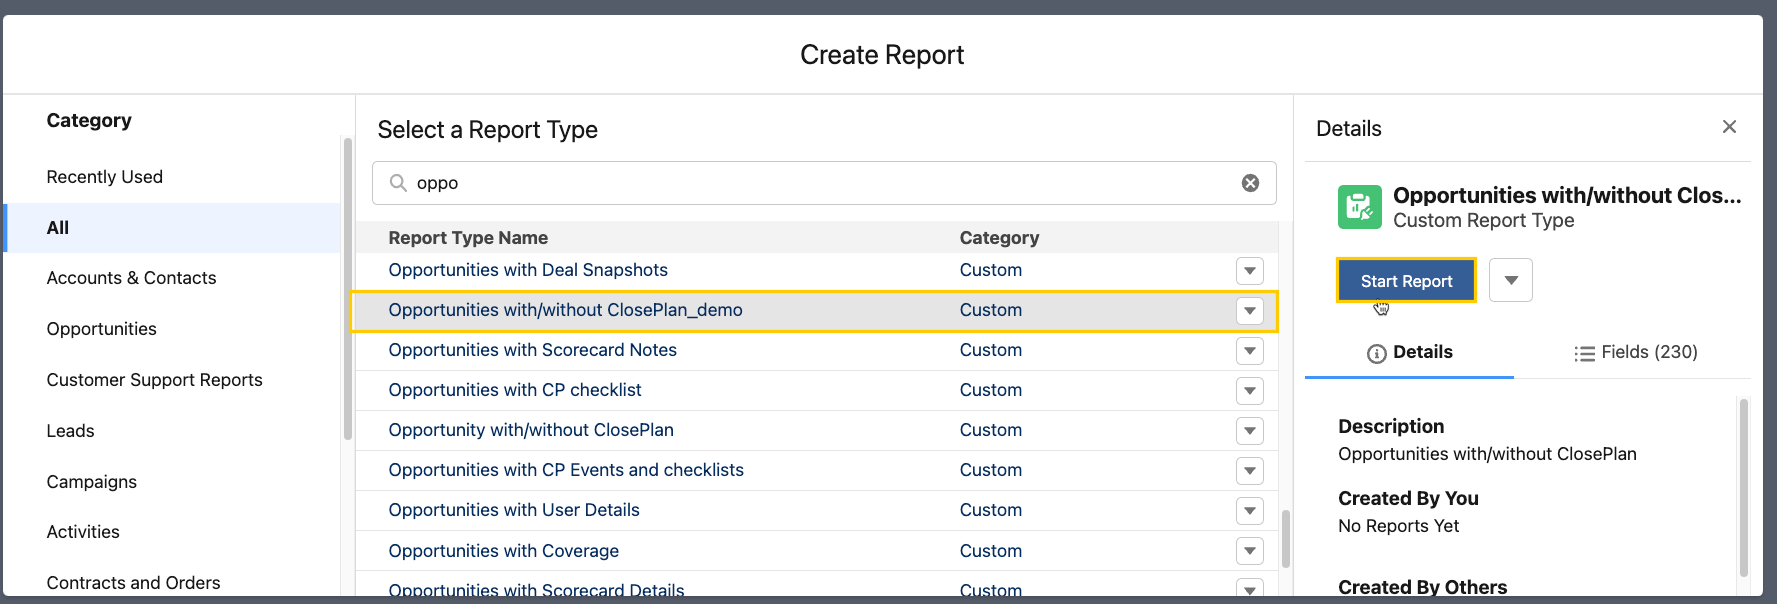
Select the report > Start Report
Add any necessary Groups
Using the search field, search for and select groups to add to your report.
For this report, we recommend adding these groups (note: your groups will vary based on the report you are building).
| Opportunity Owner: Full Name |
| Opportunity Name |

Add Columns
For this report, we recommend adding these columns (note: your columns will vary based on the report you are building).
| #amount | EB % |
| Stage | M % |
| Forecast Category | DC % |
| Close Date | DP % |
| # Days to Close | PP % |
| Next Step | Co % |
| # SC Last Modified (Days) | Age |
| # Scorecard Score % | Playbook Completed % |
| IP % | Role Goal % |
| Ch% | # Stakeholders |
Using the search field, search for and add each column.

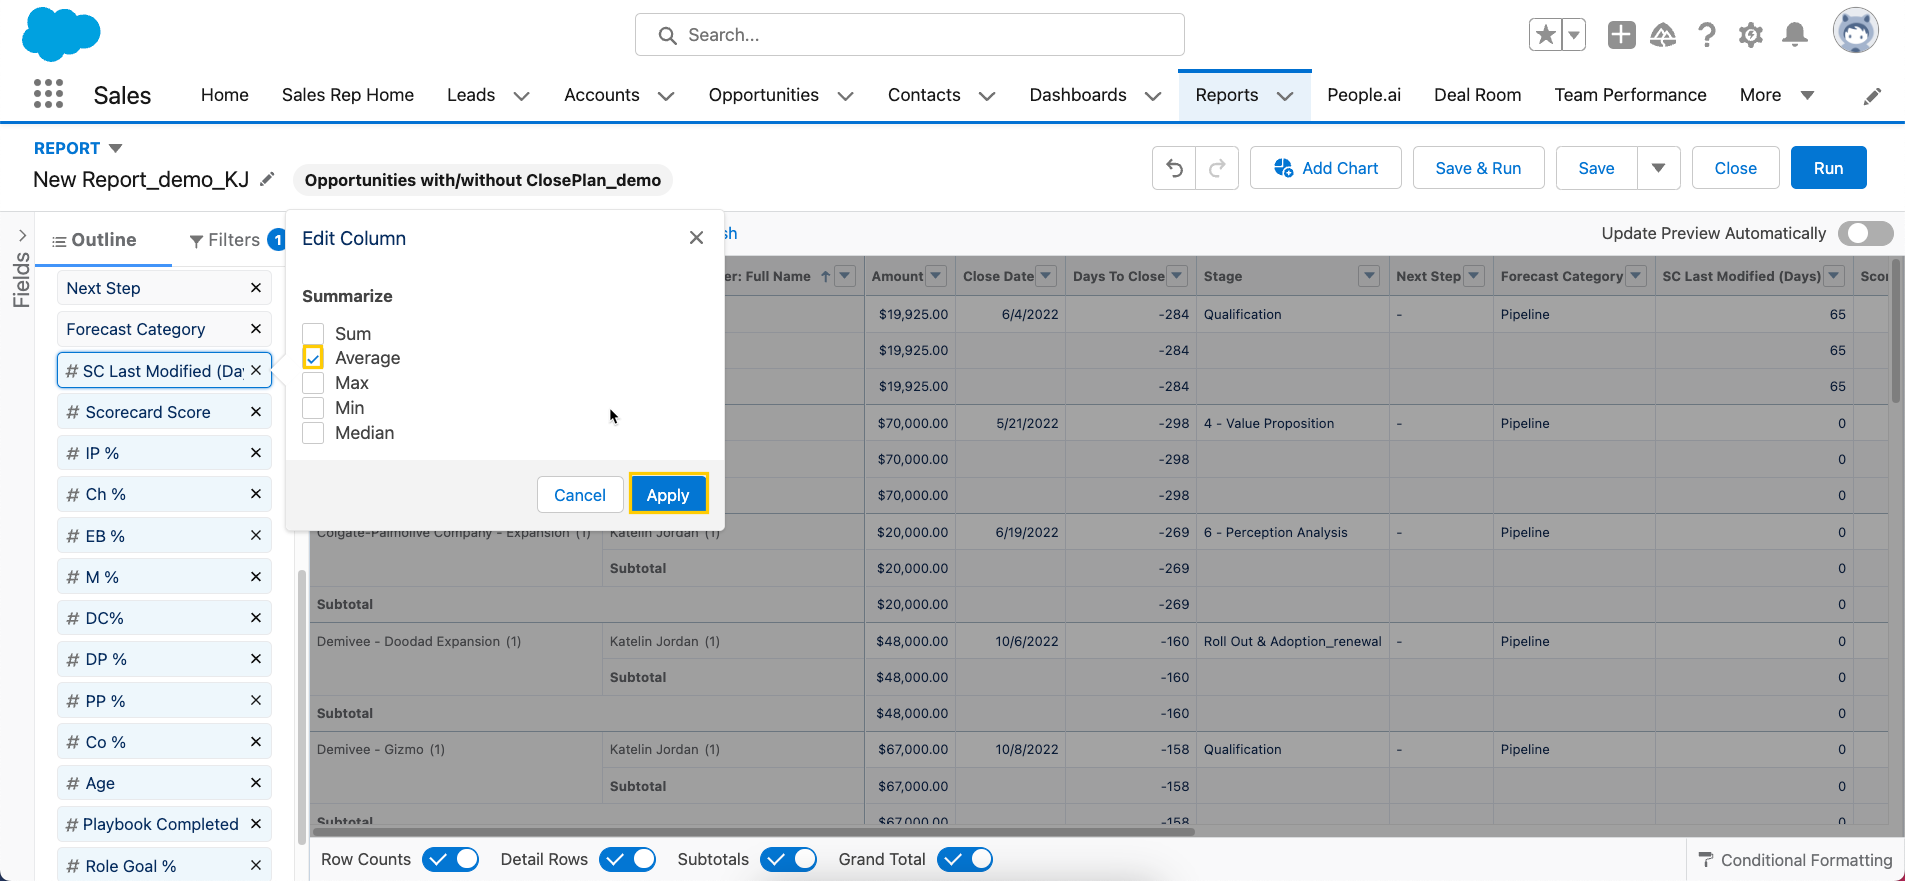
Edit the Columns to summarize.
Click on the column field > select the correct function and Apply.
Use Sum for the following Fields
| Amount | # Stakeholders |

Use Average for the Following Fields
| # SC Last Modified (Days) | Age |
| # Scorecard Score % | Playbook Completed % |
| IP % | Role Goal % |
| Ch% | DC % |
| EB % | DP % |
| M % | PP % |
| Days to Close | Co % |
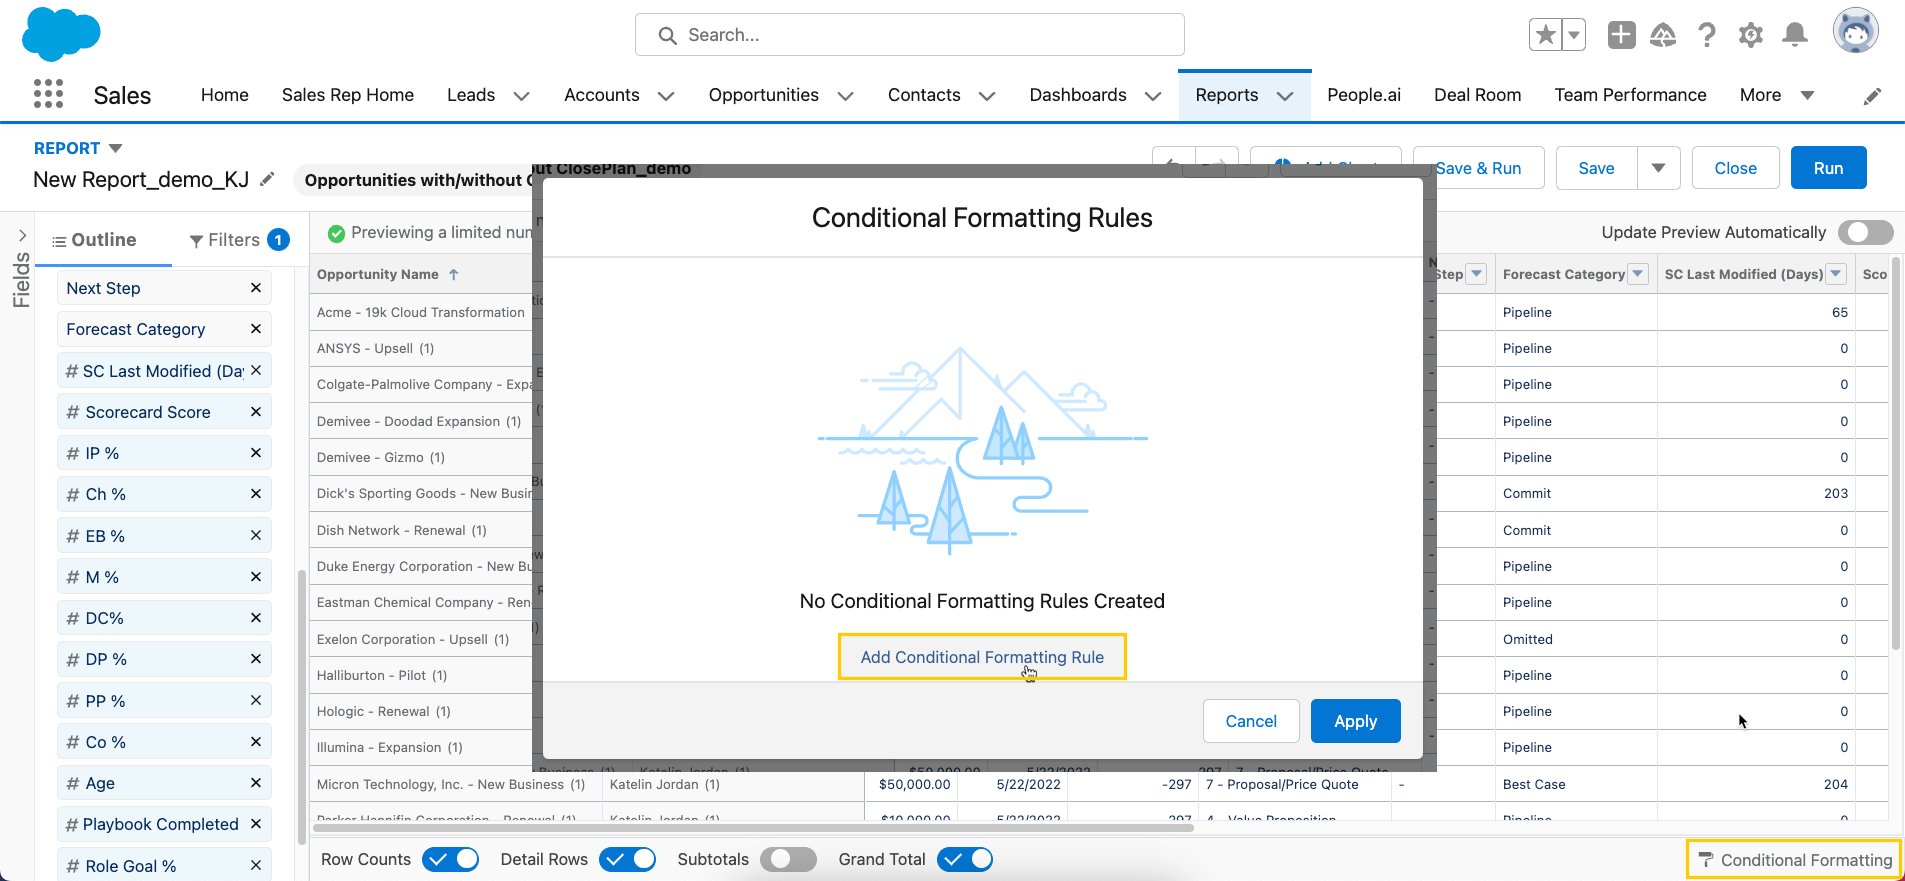
Conditional Formatting
| Conditional Formatting is limited to 5 fields. |
Click on the Conditional Formatting button in the bottom right corner of the report > Add Conditional Formatting Rule.
Add the following conditional formatting rules:
| Field |
Limits |
Description |
|
Average Scorecard Score %
|
Lower Limit - 0
Upper limit - 50
|
Provides the overall Average Scorecard Score %
|
|
IP%- Identify Pain
|
Lower Limit - 0
Upper limit - 50
|
Identification of a customer’s pain is essential for determining whether or not an Opportunity exists.
|
|
Ch%-Champion
|
Lower Limit - 0
Upper limit - 50
|
A Champion selling your product from within increases your probability of closing a deal
|
|
EB %-Economic Buyer
|
Lower Limit - 0
Upper limit - 50
|
Identifying, meeting, and confirming value with the Economic Buyer drastically increases close rates.
|
|
Average SC Last Modified (Days)
|
Lower Limit - 14
Upper limit - 20
*Note: You will need to invert the colors so that the conditional formatting acts appropriately: Green, Yellow, Red
|
It shows how recently the scorecard was updated. A scorecard with old data is less trustworthy than a recently updated scorecard.
|
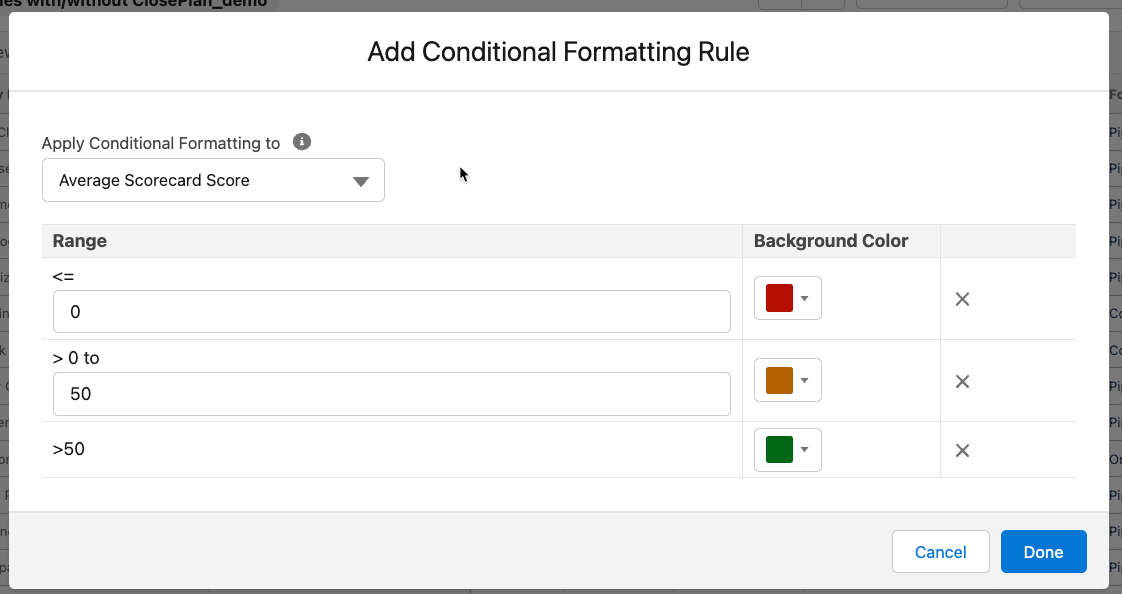

Your final rules should look like this.
Click Apply.

Disable Detail Rows to show the conditional highlighting in the report.

Filters
Finally, adjust the filters to meet your needs.

Click Save & Run to generate your report and save it for future use!
We recommend creating a new folder named “ClosePlan” to hold your report.
Your final report will look something like this:

The data displayed in this report is demo data.
That's it!
To Learn about additional Reports you can create, check out the Help Center Documentation.
|
Note: If you are missing data you expect to see in your reports, you may have forgotten to configure the custom Scorecard Category Score and Formula fields and deployed templates.
|